
Ever since the release of StatsBomb 360, we’ve shown how this new dataset is the ultimate upgrade on traditional event data.
360 allows you to detect deeper insights, such as players who receive the ball in space, the positioning of defenders around each event, whether a pass was line-breaking and how many defenders it bypassed, and plenty more. On top of this, we’ve shown you practical use cases for the data in finding new insights into football and creating bespoke visualisations which display this.
However, 360 data is not just a valuable tool to turbocharge the work of skilled data analysts and programmers. The unique, contextual information can be a part of an analyst’s day-to-day responsibilities – allowing them to upgrade their workflows in conjunction with video (or whatever their preferred medium of presenting is). Here are some exciting use cases and scenarios where 360 can provide extra context across a variety of areas of football!
Opposition Analysis
Depending on the analyst’s role with the club and how the staff decide to delineate their efforts throughout the week, analysis of upcoming opponents will take up a significant portion of the day. Whether your starting point is video or data, 360 can provide contextual insights to support both.
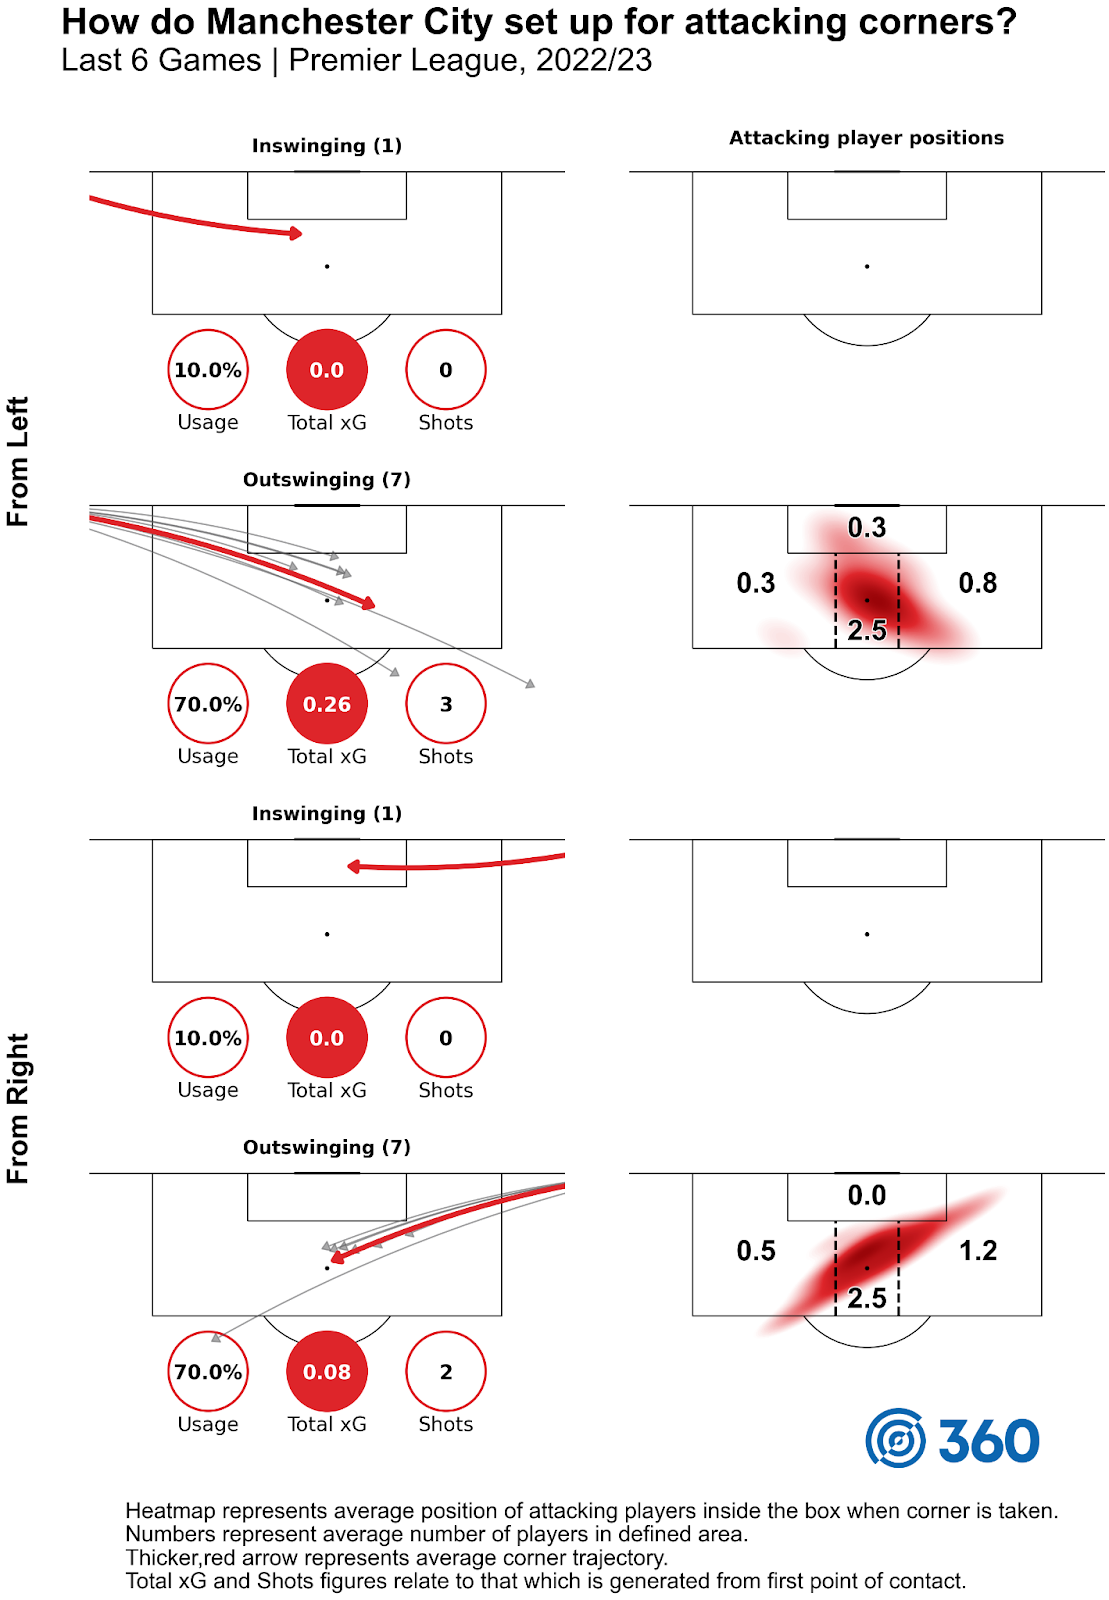
Take, for example, set plays. Event data by itself can tell you a lot: the x/y coordinates of the delivery, the technique, which players were involved, and the outcome of the set play. 360 enhances this by providing us with the positioning of the attacking and defending players in the box, giving the analyst more detailed information about the strategies utilised by the upcoming opposition. This can be useful as a starting point and as a final filter within a data-driven analysis. In conjunction with video, it can save time by letting you know what to focus on providing clips for, eliminating filler information that the team might use sparingly, and also serving to better highlight the key threats the opposition might utilise.
Another example is when looking for trends in the opponent’s open play chance creation. Specifically, metrics such as passes received in space and line-breaking passes. There's a marked difference in raw event data compared to the insights from 360 data: like the corner kicks and set plays example, the raw event data misses context that can take your analysis to the next level. Sure, progressive passes are important, but who is receiving them? Are they in valuable areas?
To create one example that will likely come up every season: a centre back who consistently breaks lines to find wingers inside the half spaces. This is the kind of detail that an analyst would report to his coaching staff as an area of their defensive organisation that requires thought. There is much more happening on a football pitch than between point A and point B, and the positioning of individual players on the pitch has a huge say in what does happen.
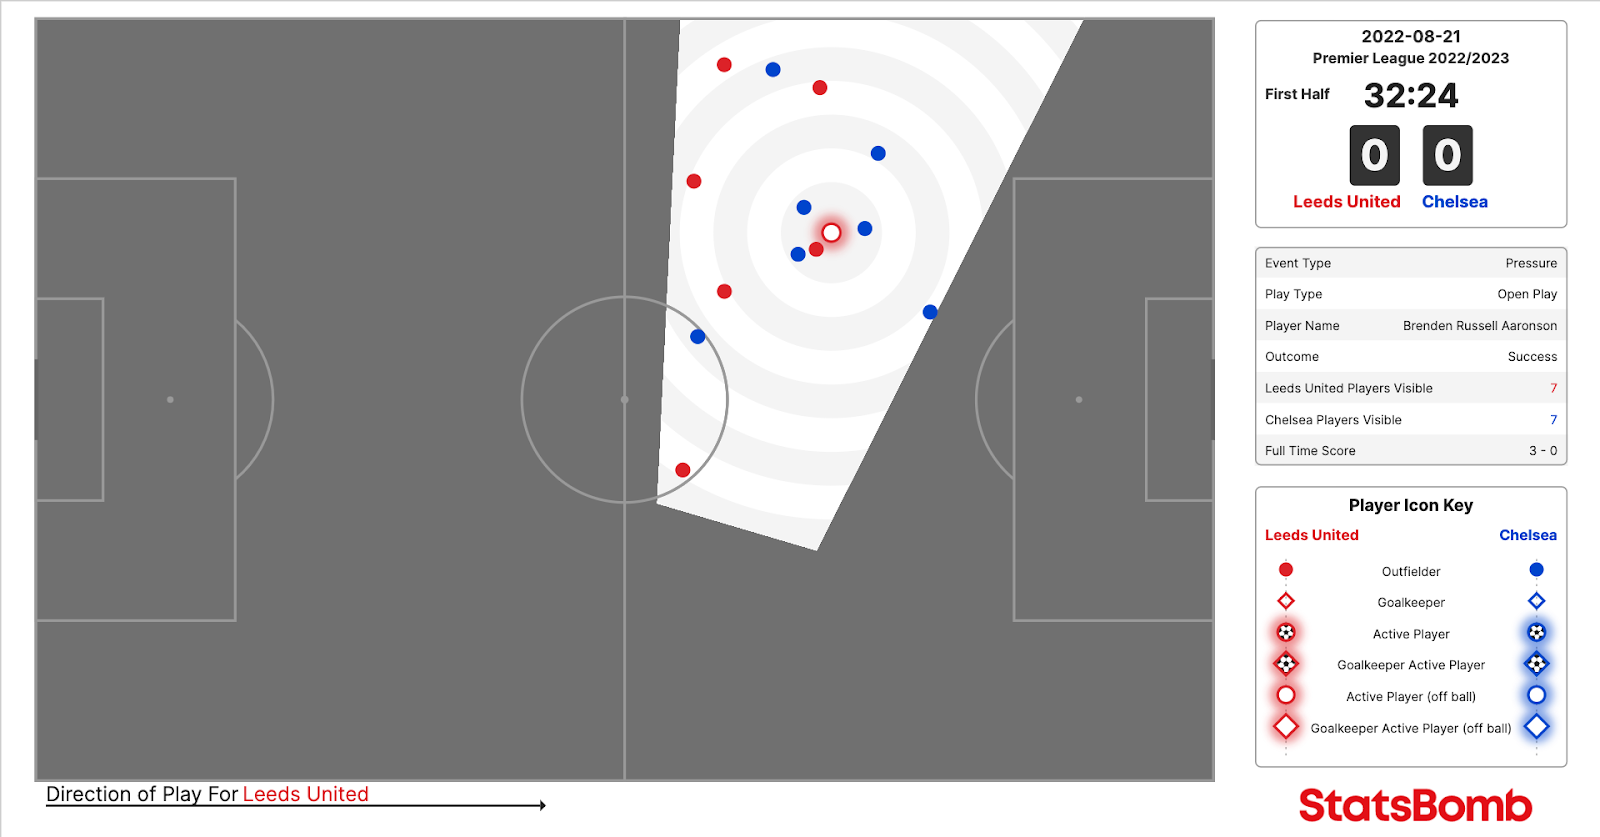
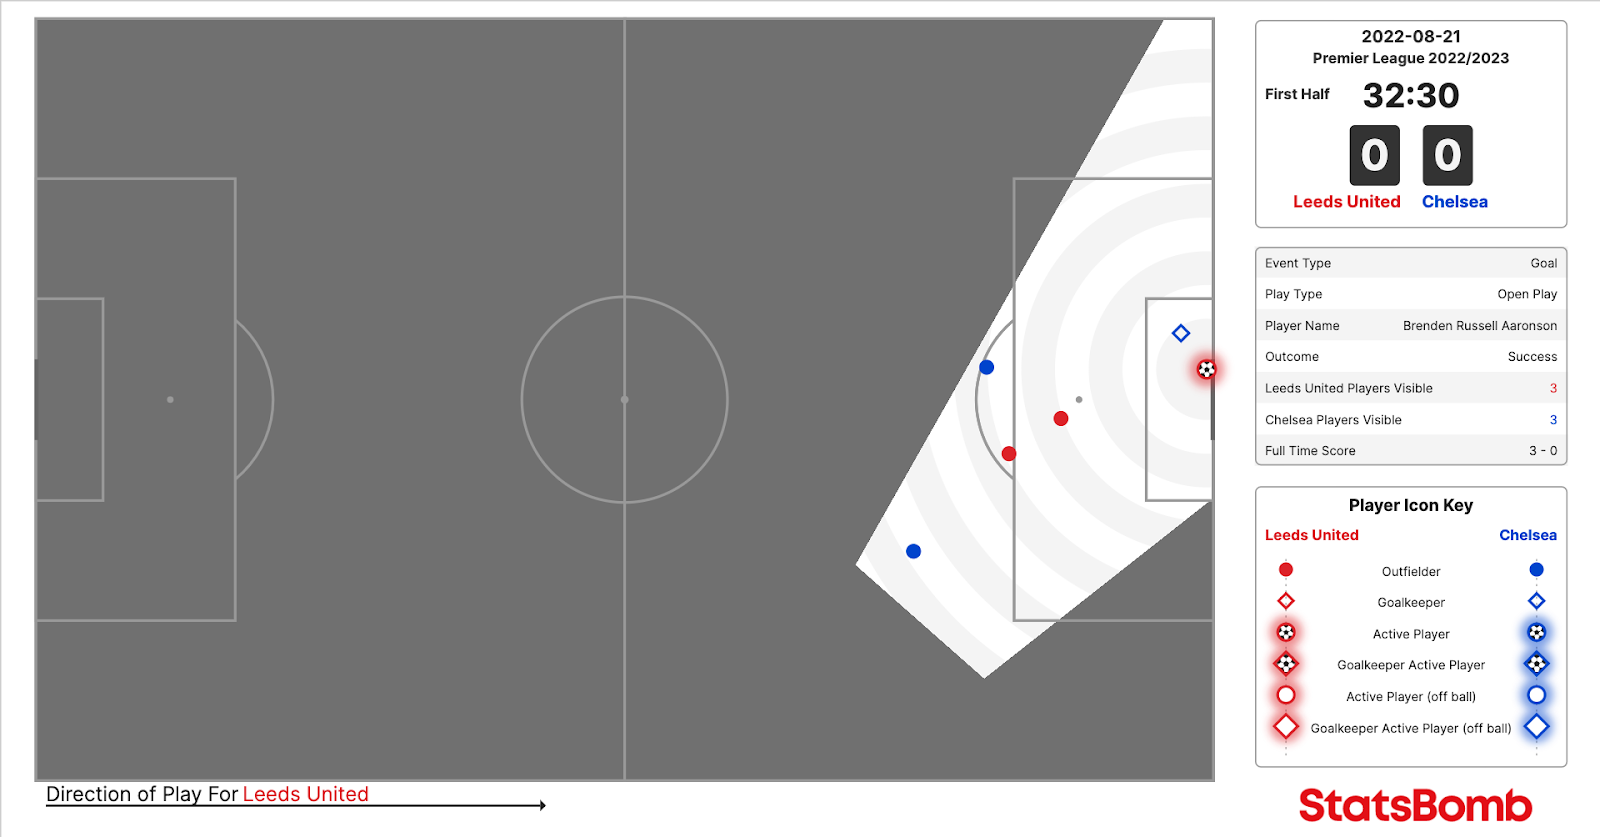
Or, perhaps an analyst is working for a team that looks to create a lot of high press shots. What pressing structures have teams succeeded with against our upcoming opponents to create these situations? Below we see the Leeds press against Chelsea which led to their opening goal in the recent fixture – the orientation of Jesse Marsch’s defenders, which forced the back pass to Mendy and the eventual error.
Individual analysis and recruitment
How about on an individual player level? Whether it be on the performance analysis side or the recruitment side, there are tons of fun things you can do.
Outside of the team dynamic, a major part of an analyst’s workflow is keying in on individual threats and weak points that might exist within a team’s structure.
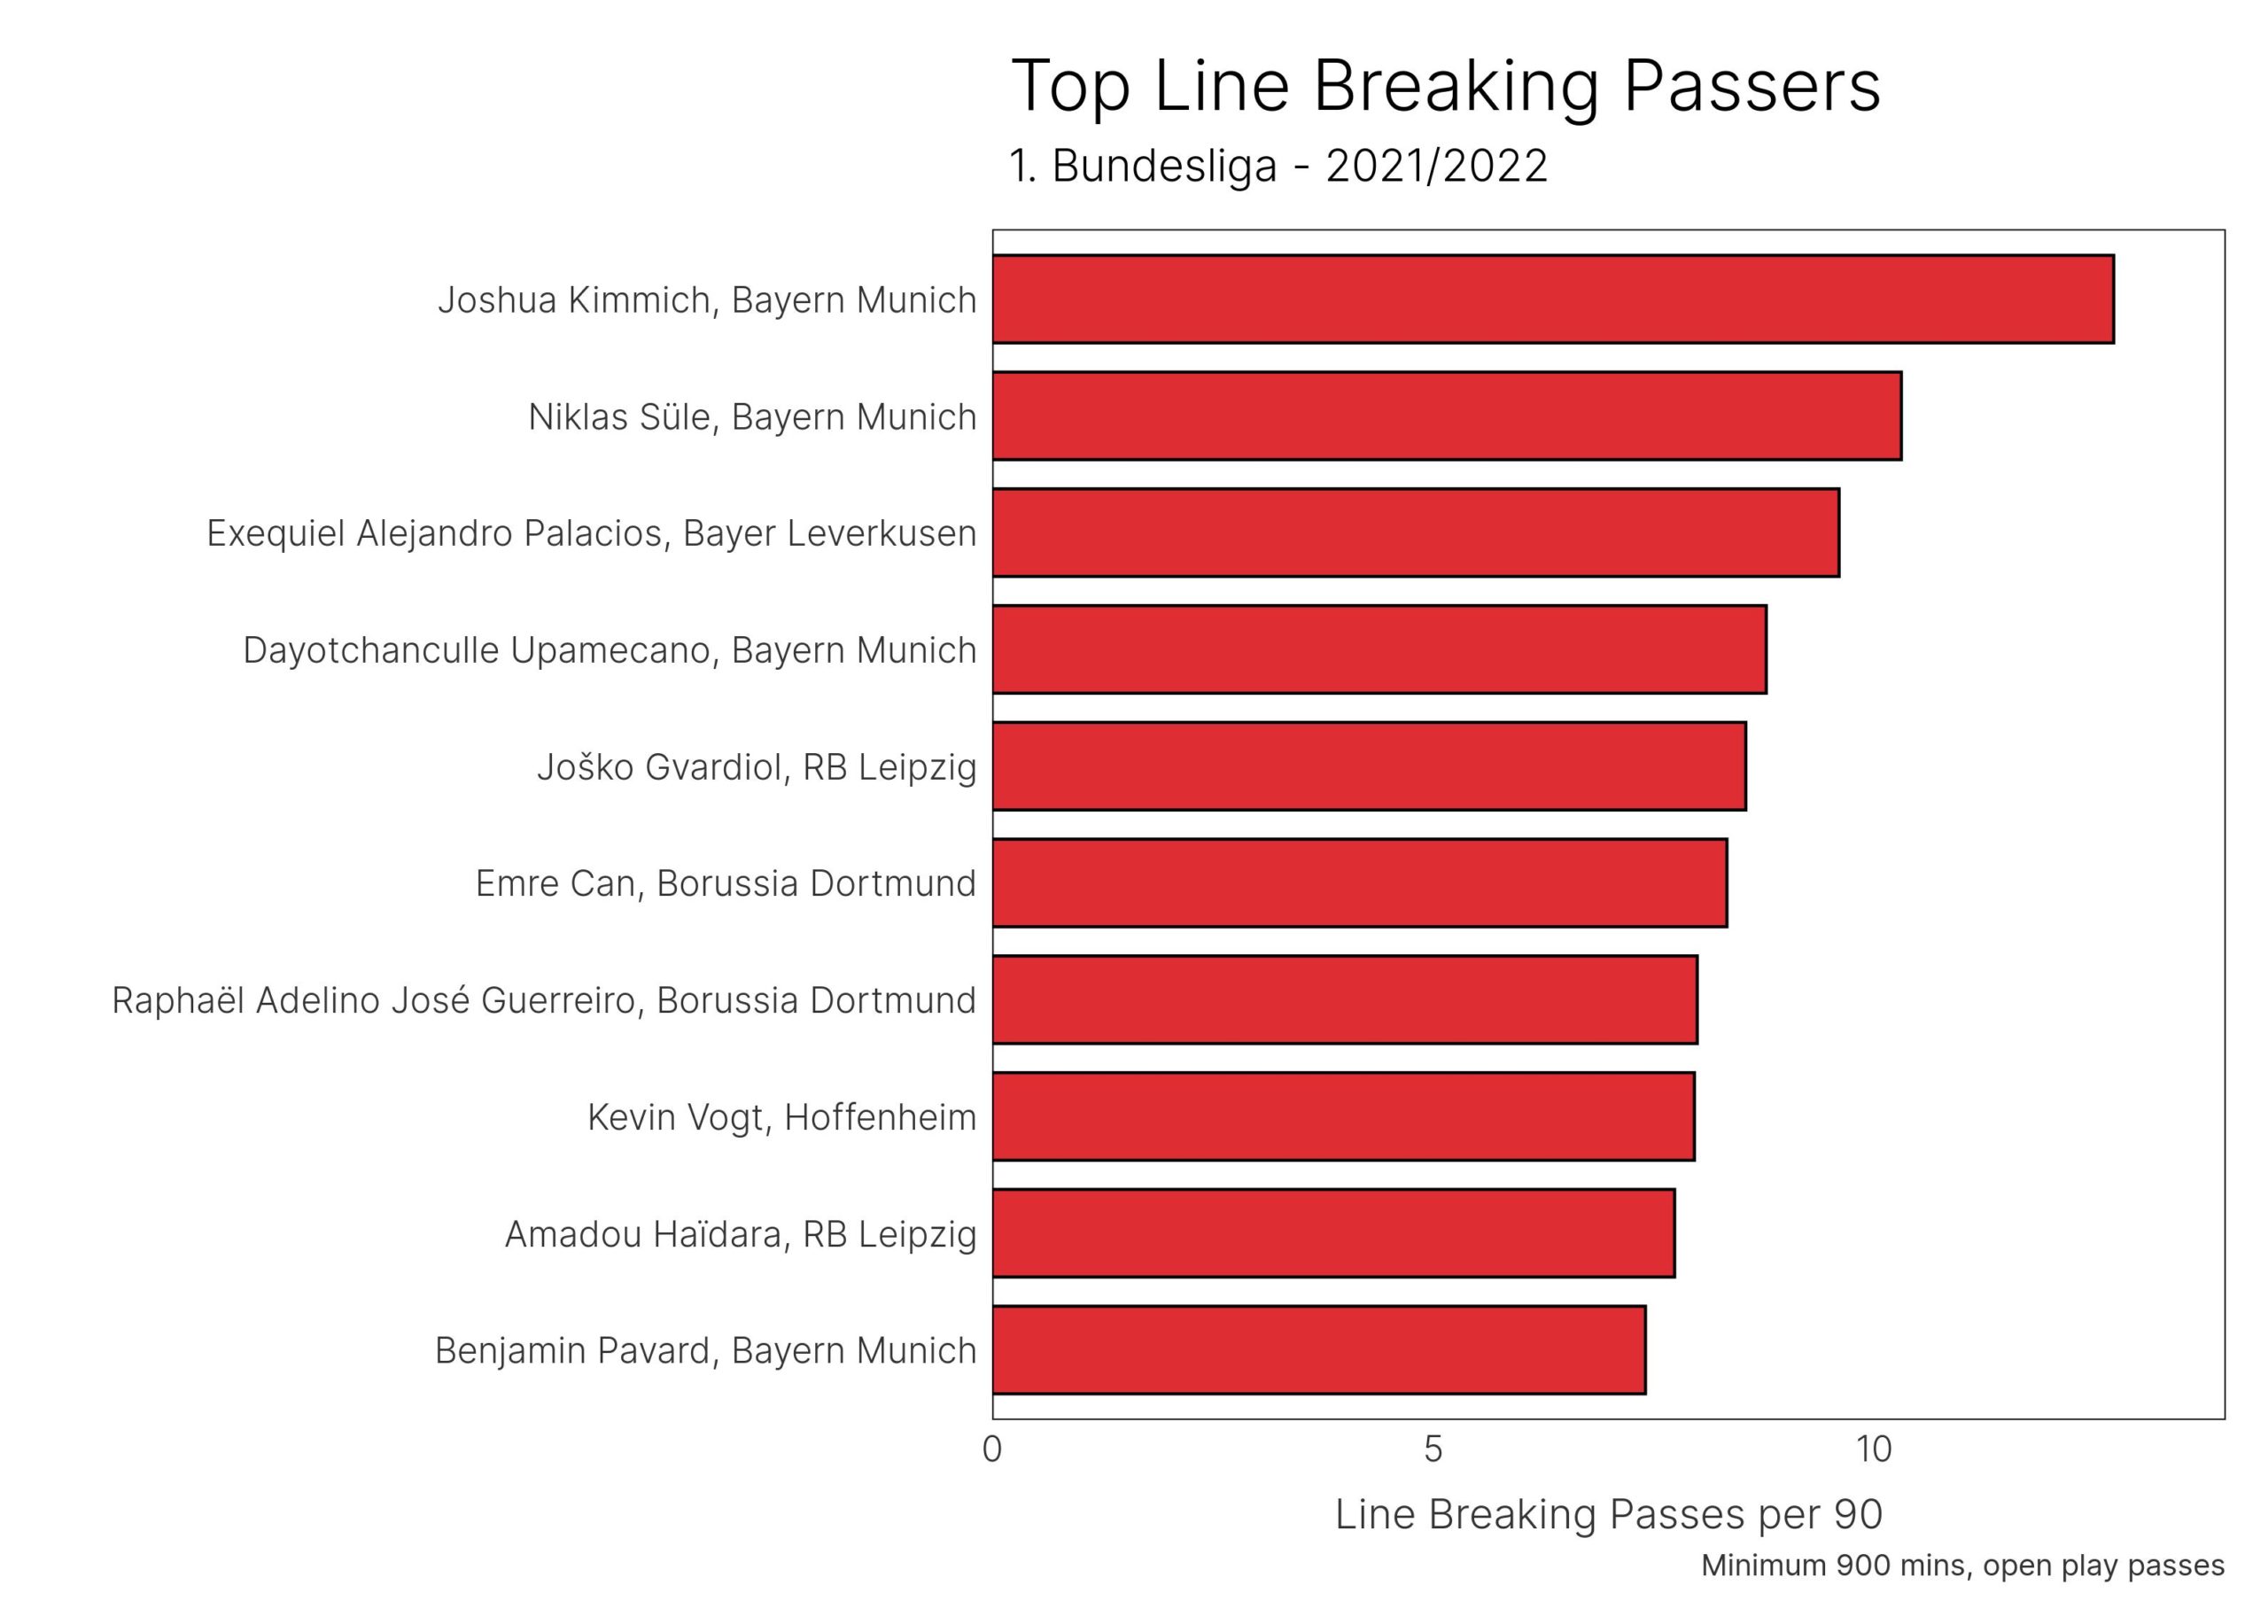
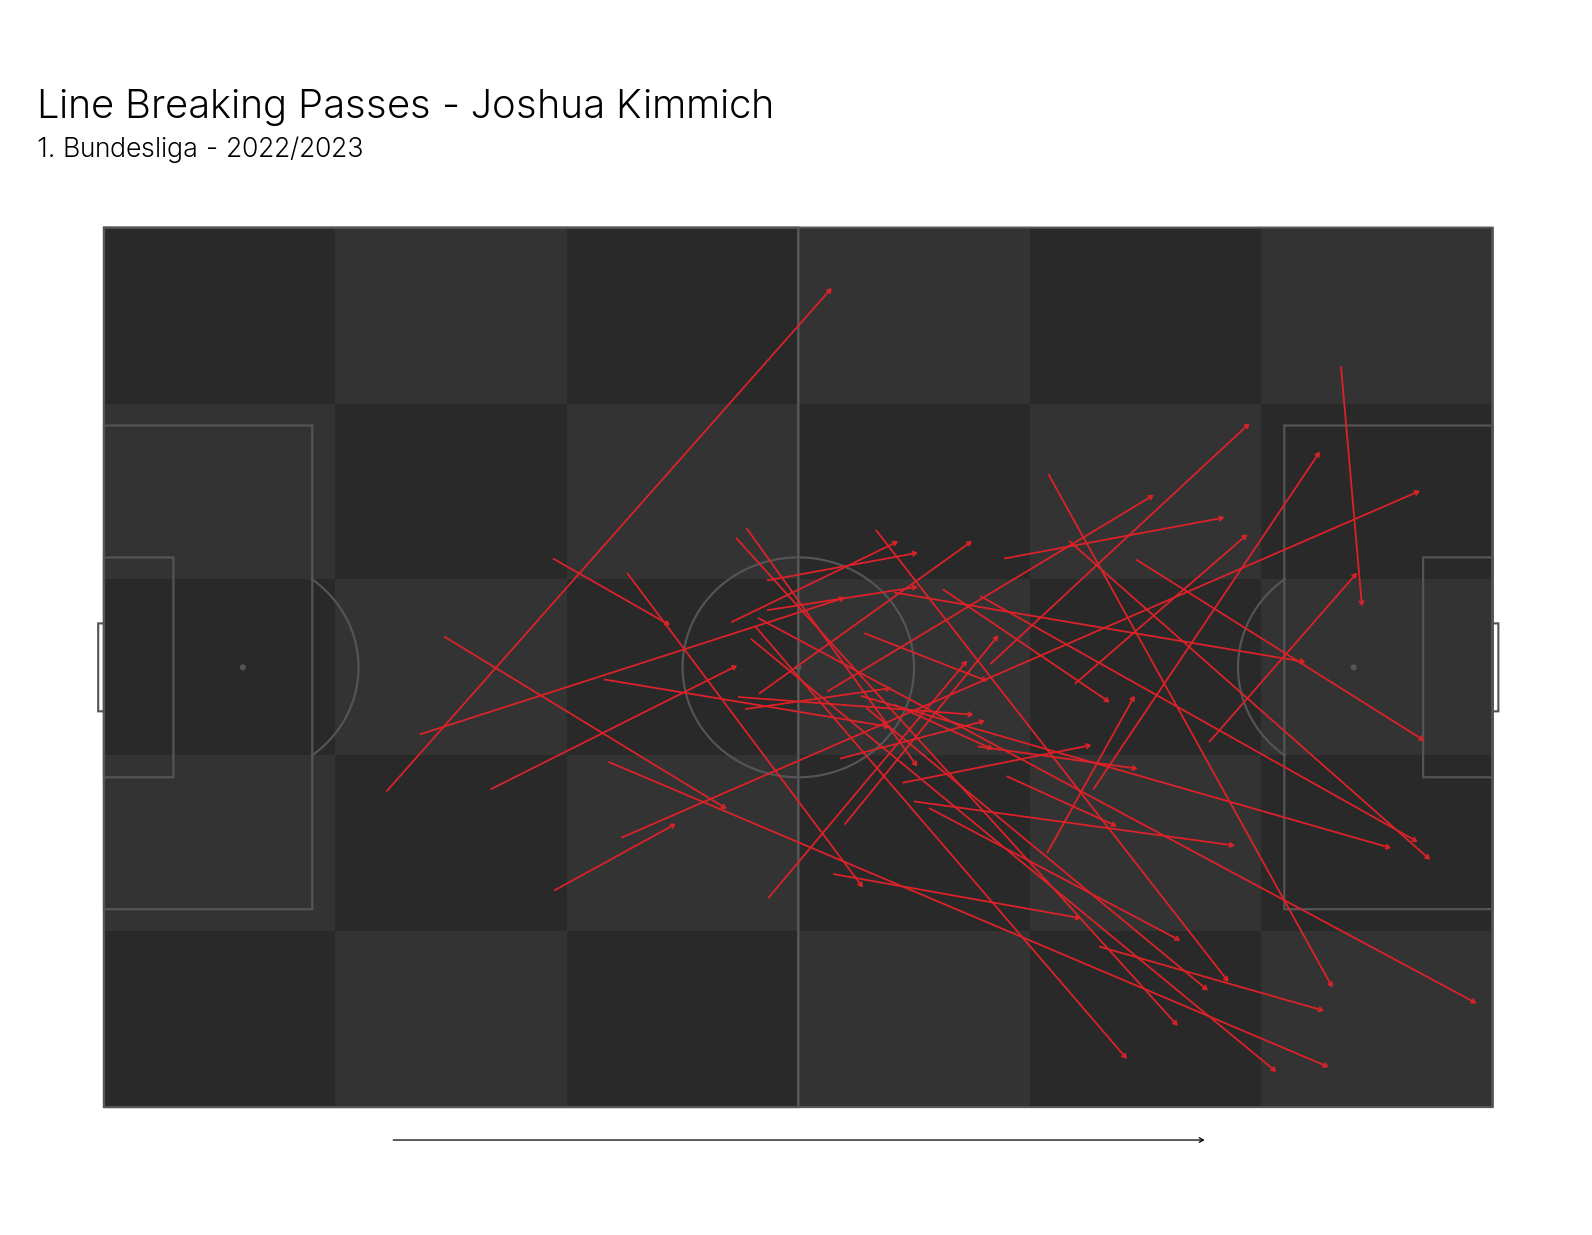
As an example, let’s say you’re playing Bayern Munich at the weekend and noticed that Joshua Kimmich was an important part of their build-up play – the line-breaking pass data backs this up. Now we can provide better, actionable insights to the coaching staff (“we might want to protect the centre of the pitch!”) and provide this information in whatever medium works best for you and your coaches, whether it be video or simple visualisations like the one below.
What about recruitment? When looking to sign players and invest significant amounts of money in them, it’s important to know you’re bringing in players who you can be confident fit a system.
To illustrate this, let’s put ourselves in a hypothetical scenario. Your team needs a centre forward who is good at positioning themselves in the box off cutbacks, one of the most valuable chance creation methods you look to score. We can use 360 data as a final filter to identify these types of players, speeding up the vetting and scouting processes.
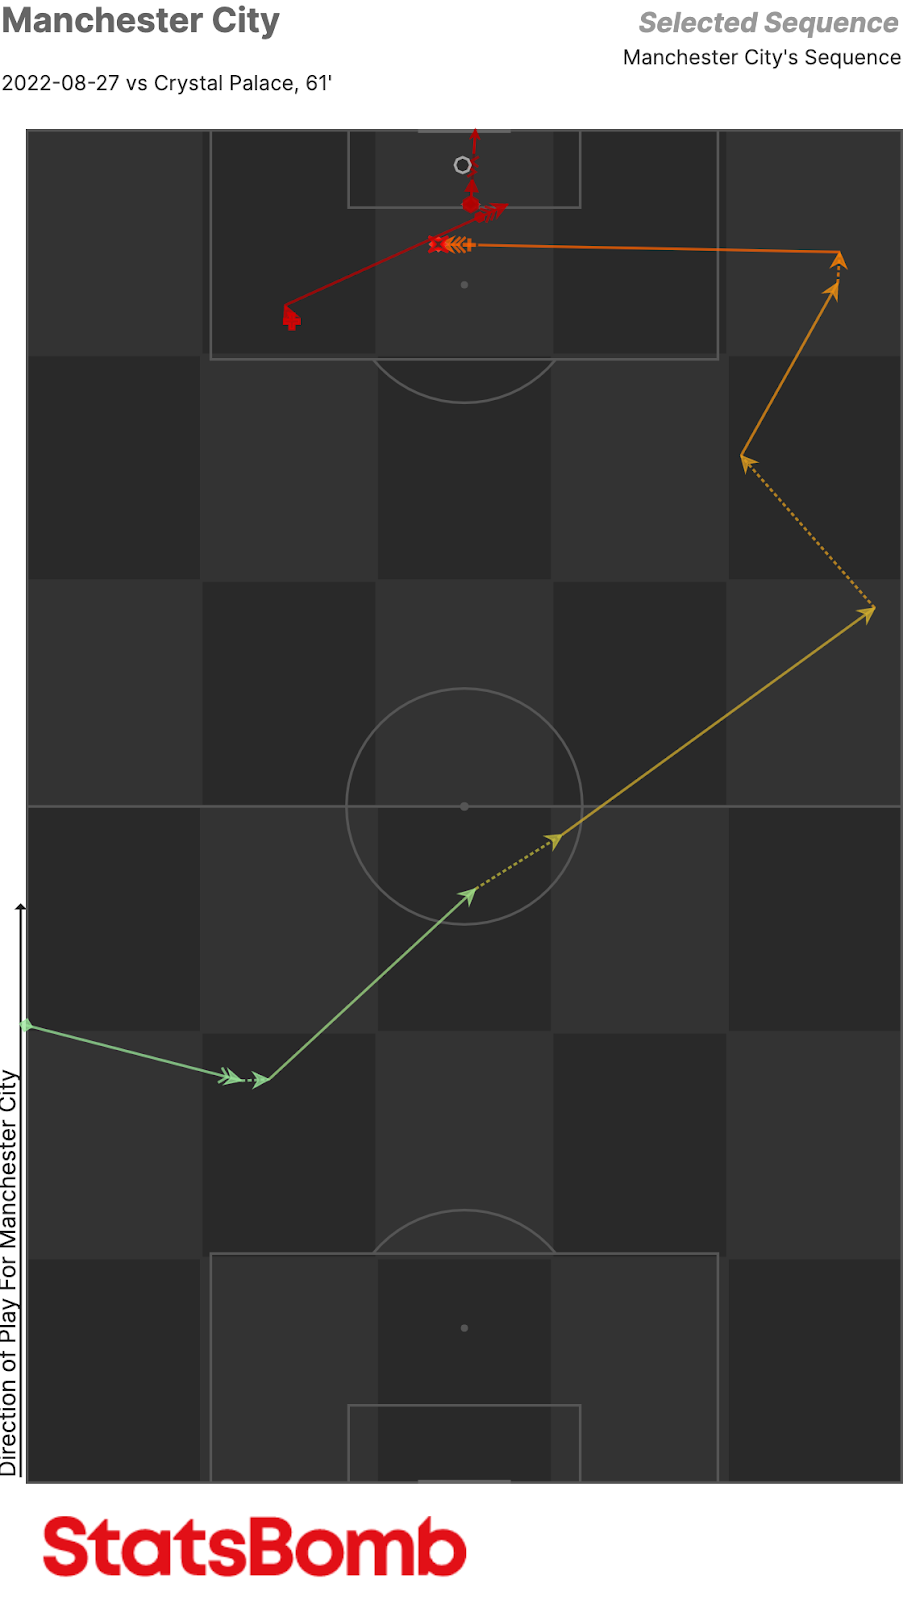
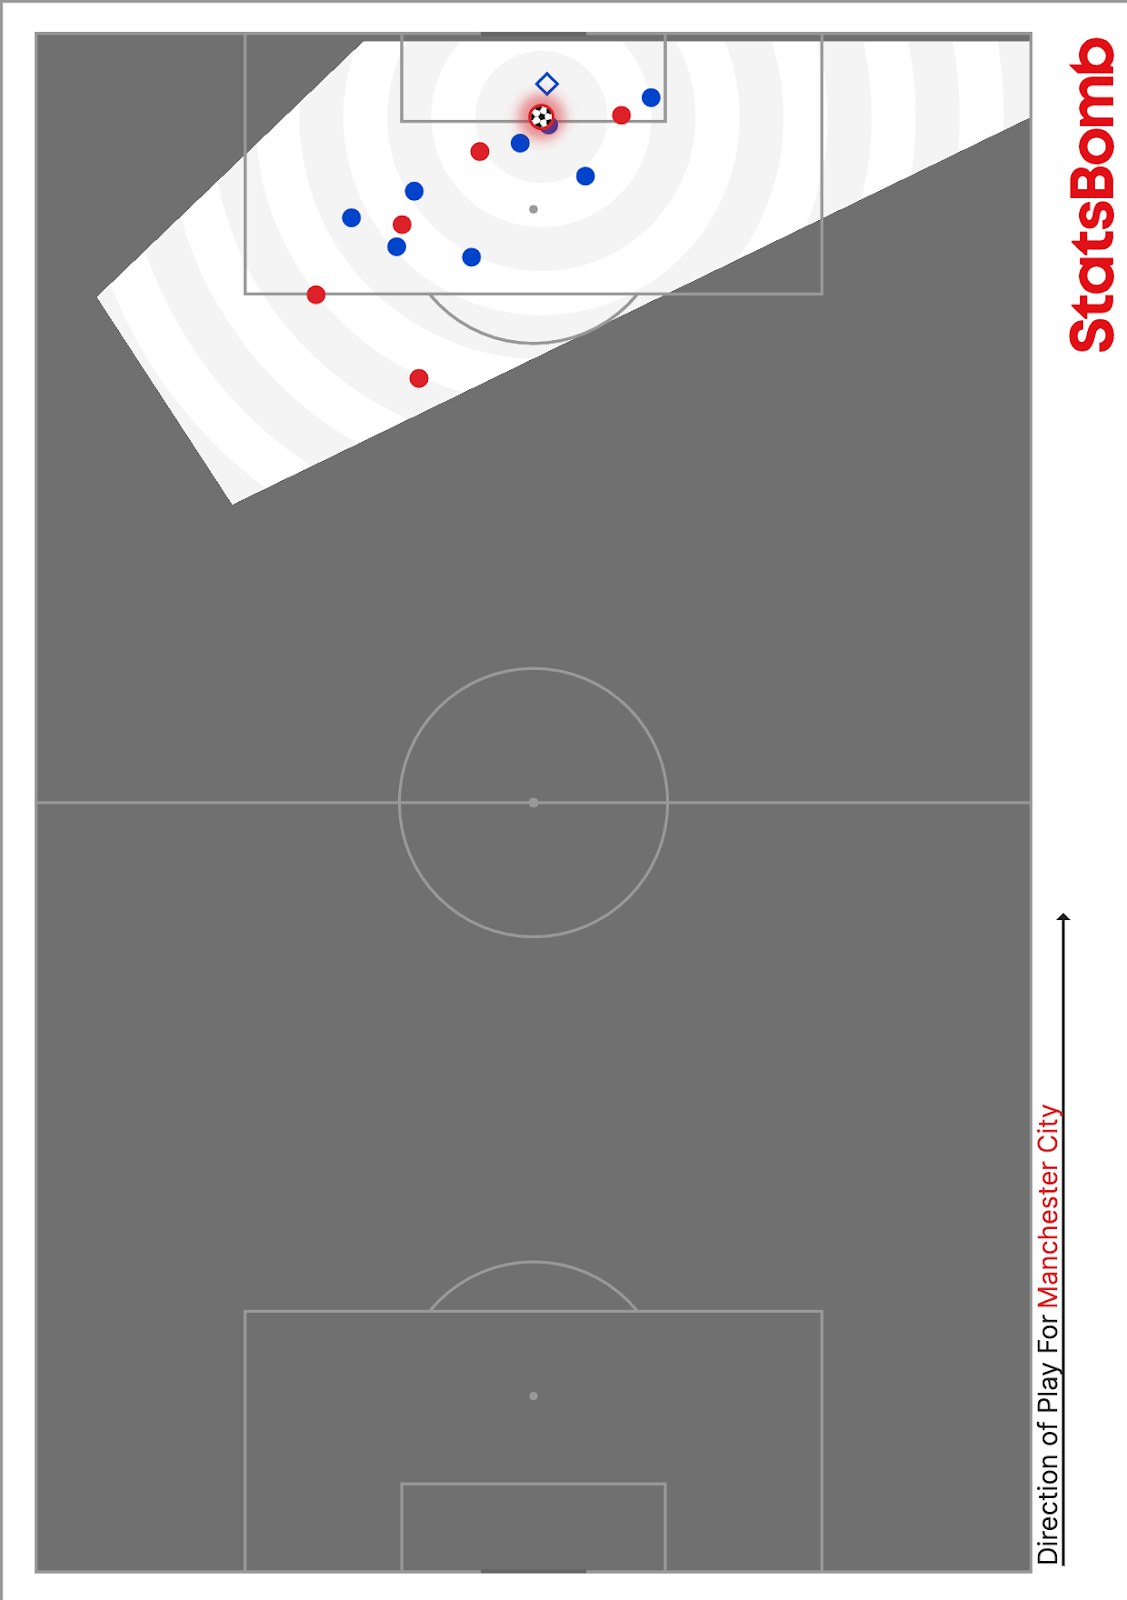
The two visualisations below of Erling Haaland’s recent goal against Crystal Palace are a good example of this. The raw event data provides us with the sequence of play, but the use of 360 (the second image) lets us see the complete picture surrounding the event: Haaland’s position, the positioning of the Palace defenders, etc. Using data outside of single, isolated events and over the course of larger sample sizes can help to ID possible fits for your team.
Accessibility
So, 360 data is only useful for analysts with sophisticated knowledge of programming, APIs, and visualisation techniques, right? Wrong!
StatsBomb are (very shortly) making all our 360 metrics available in our IQ platform. This means that anyone – regardless of having a background working with advanced datasets or not – will be able to draw insight into all areas of the game with the data.
Not only will the data be available at your fingertips in IQ, but it’s also packaged in a way that makes sense to football people. Any analyst will know that the quality of your delivery is one of the most important aspects of analysis work, and 360 data is a tool that has an incredible ability to provide instant actionable feedback. When linked with video, this type of information can be used by people at all levels of “data literacy” within a club, enabling a data-driven culture to reach all areas of your staff.
More details will come soon on the 360 metrics release into StatsBomb data and IQ. Until then, feel free to hit me up on Twitter if you have any questions about using StatsBomb data in your analysis workflows.